Introduction
With a global population expected to reach more than 9 billion people by the year 2050, farmers are under more pressure than ever before to implement more efficient and sustainable systems of food production. In addition to meeting the rising demand, they must cope increasingly with unpredictable climatic conditions and shrinking natural resources. In animal production, the trend is moving toward precision feeding, which, however, requires accurate knowledge of the raw materials used and of the animals’ nutrient requirements. Yet the quality of feed raw materials is subject to natural fluctuations, and this variability can negatively affect the health and performance of livestock if it is not recognized and compensated for. Inconsistent raw materials or feeds can impair growth, weaken gut integrity and immune function, and increase susceptibility to pathogens — resulting in poorer feed conversion rates.
Therefore, the goal of feed formulation and production is to meet the needs of the animals without oversupplying them. When this balance is achieved, it supports animal performance, the profitability of animal production, and reduces the environmental footprint.
Raw material analysis forms the basis for precision feeding
A precise analysis of the raw materials being used is the first step toward need based nutrition. Feed mills and on farm feed mixers that rely on nutrient data from their own raw materials are better able to manage variability in those raw materials and ensure that each animal’s ration is aligned as accurately as possible with its needs. Near infrared spectroscopy (NIR) has established itself as a valuable analytical tool for this purpose, as it enables rapid yet precise analysis of nutrients in a wide variety of raw materials and compound feeds.
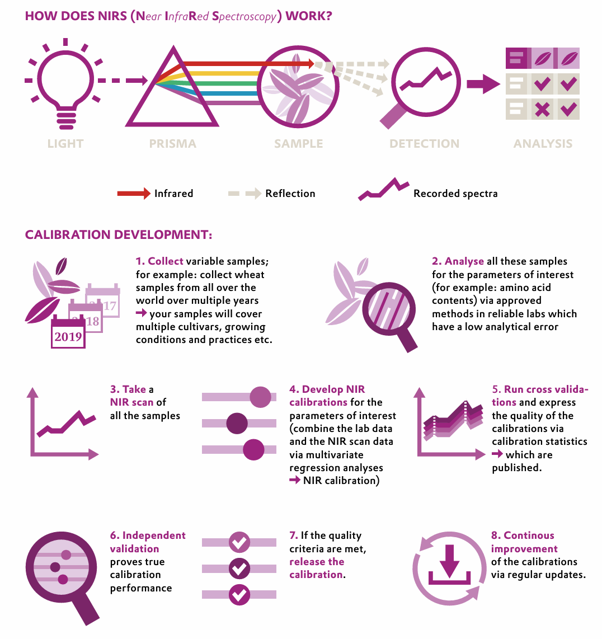
NIR can provide precise analysis of raw materials — but only if good and robust NIR calibrations are available. In developing NIR calibrations, NIR spectra of many typical samples of a material are combined with the corresponding analytical values which have been derived using reference methods. A NIR calibration describes the correlation between the spectra and the reference values. By applying this correlation to the spectra of unknown samples, all calibrated parameters can be mathematically predicted. The quality of NIR calibrations therefore depends largely on a comprehensive sample database and the quality of the reference analytics used — that is, the quality of the laboratory (see Graphic: How does NIR work?).
Maintaining an extensive sample database is one of Evonik’s core objectives in order to provide its AMINONIR® analytical services. Evonik operates laboratories on five continents and can therefore offer fast and reliable analysis of feed raw materials based on an extensive, globally collected database.
Evonik continuously monitors the performance of all AMINONIR® calibrations and regularly updates them with the latest samples. In this way, new genotypes, growing conditions, and processing conditions are taken into account, ensuring that the NIR calibrations remain as robust and relevant as possible.
Evonik has implemented the ISO 12099 standard for NIR spectroscopy in feed analysis. ISO 12099 is an important cornerstone for the development and application of NIR services, instruments, and calibrations. The ISO standard clarifies the interpretation of statistical terminology and provides guidelines for the validation of NIR procedures. This means that users can be confident that AMINONIR® services are based on validated methods and that all instruments are monitored to highest standards. Each analytical result undergoes quality control, and all reported values fall within the validated calibration range.
Feed producers can integrate AMINONIR® into their processes in various ways. Samples can be measured on site using FOSS or Bruker instruments, or they can be sent to Evonik laboratories. The process is simple: the feed material is measured using the NIR device, which directs near infrared light onto the sample. The sample absorbs part of the light and reflects part of it in an unique pattern — the so called spectrum. The spectrum is used for further evaluation, and within a few minutes a detailed report is generated. The speed of the procedure enables widespread and cost effective use and supports more consistent evaluation of feed materials as well as stricter quality control.
Evonik’s AMINONIR® translates NIR spectra into nutrient profiles for more than 60 raw materials and compound feeds. These real time data help producers verify the nutrient profile of raw materials and quickly adjust feed formulations — reducing dependence on expensive protein and energy sources without compromising animal performance.
Quality control
Precision nutrition ensures optimal animal performance and productivity — and ultimately a better return on investment. Optimizing feed composition is a proven approach to significantly influence animal health, muscle development, meat quality, and, not least, emissions. The challenge, however, lies in the variability of nutrient levels in raw materials, which can be considerable. In compound feeds, the raw materials used account for up to 70% of the variability.
If tools for precisely measuring and analyzing the nutrient composition of raw materials are lacking, this can lead to overcompensation and oversupply in the diet. An excess of amino acids and crude protein burdens the metabolism and increases nitrogen excretion — and therefore emissions per animal.
Oversupplying nutrients also results in unnecessarily higher costs because expensive raw materials and supplements are used in excessive amounts. On the other hand, accurately determining the nutrient levels of feed materials allows to formulate diets that are optimally aligned with the animals’ needs.
This is where quality control comes in as it delivers the needed data to enable precision nutrition. Traditionally, quality control served to identify products that do not meet the specifications. Today, NIR analytics is an established tool for analyzing incoming raw materials and finished feeds with minimal effort. Reliable NIR calibrations provide information on nutrient composition — not only on basic parameters such as dry matter or crude protein, but also on amino acids and fatty acids. AMINONIR® analytics is even able to detect whether heat treated raw materials have been under or over processed. This is crucial because both under and over processing can reduce amino acid digestibility and diminish the nutritional value — resulting in poorer feed quality and reduced animal performance. Feed producers would then have to include larger safety margins, which would lead to higher emissions and reduced profitability. Overall, NIR analytics revolutionized quality control and it is delivering precise nutritional data which are needed in diet formulation.
Based on decades of scientific research and expertise, AMINONIR® can be used directly on site in feed mills to determine and document the precise nutrient content of raw materials or feeds within minutes. A single NIR instrument can easily analyze more than 10,000 ground or unground samples per year, enabling comprehensive quality control and the development of valuable datasets.
These datasets can be used for far more than quality control. Their evaluation reveals qualitative differences between raw materials from different geographic origins, between suppliers, or between different processing methods. Such insights help to reduce variability overall and to secure competitive advantages through demonstrably higher quality of finished feeds and smarter purchasing decisions.
Examples
Sorghum has gained interest and importance in recent years because it requires very little water and achieves reasonable yields even in drought years. The nutrient composition of sorghum is very similar to that of maize. Based on 168 wet chemistry analytical data points, sorghum has an average starch content of 64.44% (88% dry matter), and maize has an average starch content of 63.93% (88% dry matter; n = 739; source: AMINODat®; Table 1). Average values provide information about the typical composition. However, for practical feed formulation, it is important to obtain and use the most precise data for the locally available raw materials. This is where NIR analytics shows its strength by enabling fast and precise analysis with minimal effort.
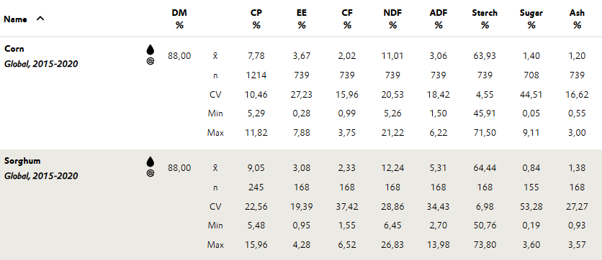
Table 1: Composition of Corn and Sorghum ( AMINODat®; CP = Crude Protein, EE = Ether Extract; CF = Crude Fiber; NDF = Neutral Detergent Fiber; ADF = Acid Detergent Fiber)
At Evonik, more than 53,300 sorghum samples were analyzed by AMINONIR® over the last five years. A closer look at the starch results, plotted as a distribution curve, shows that starch ranges from 60–70%, with a standard deviation (SD) of 1.54, corresponding to a coefficient of variation (CV) of 2.33% (Figure 1). The dataset contains samples from Australia, Bolivia, Brazil, China, Germany, India, and Mexico. When the starch content of sorghum is plotted per country (Figure 2), the distribution curves differ significantly in shape from a normal distribution. For example, the Chinese data show a bimodal distribution, and the Australian dataset has a shoulder at around 65% starch. The German dataset contains many samples with high starch contents of 68–71% which are not found to the same extent in the other countries. A more detailed evaluation of the data would be desirable to identify factors that allow further subdivision into more homogeneous, ideally normally distributed, subpopulations. Such factors may include variety, growing region, and growing conditions.
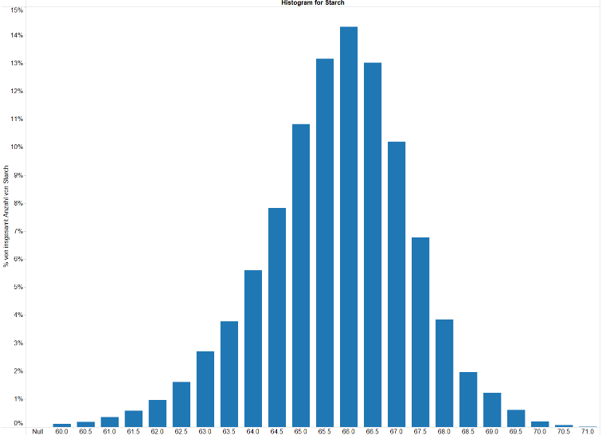
Figure 1: Starch content (%) of Sorghum (n = 53300; Jan 2021 to Sept 2025; Median: 66%, STD: 1.54; CV: 2,33%; AMINONIR®)
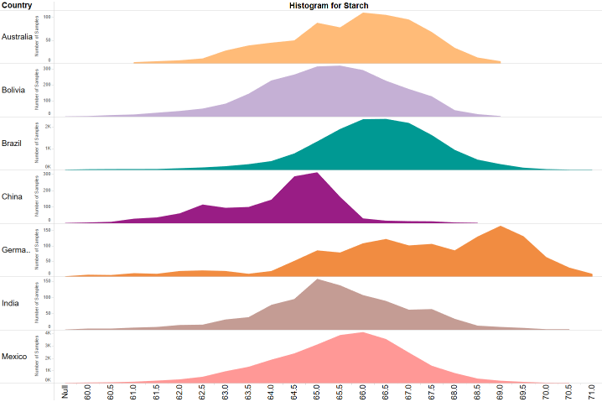
Figure 2: Starch content (%) of Sorghum per Country (AMINONIR®)
Maize has an even wider starch range than sorghum. Over the past five years, more than 200,000 corn samples showed starch levels between 55–72%, with an average of 64.70%, a SD of 1.50, and a CV of 2.3%. When considering country of origin (Figure 3), Germany had the highest average starch content (66.10%) and the USA the lowest (64.30%). The distribution curve of German maize appears left skewed and shows a shoulder on the left side at around 65% starch, indicating a subpopulation and suggesting that splitting the dataset could be beneficial. In Spanish maize, many samples with a low starch content of 56–62% stand out. These low values occurred particularly in the years 2021, 2022, and 2025.
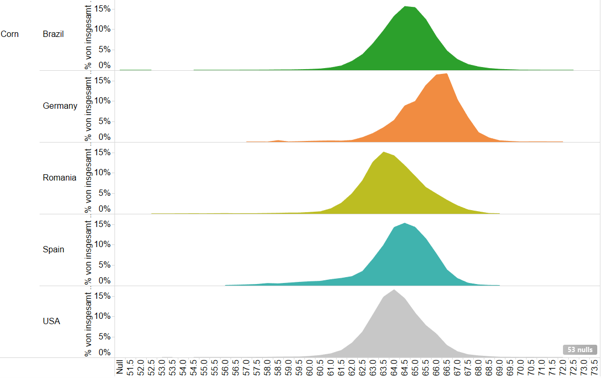
Figure 3: Starch content (%) of Corn per Country (AMINONIR®)
Energy
From a nutritional standpoint, variation in starch content primarily means variation in energy content, which must be considered in feed formulation. Looking at the energy content of sorghum by country (Figure: 4), the distribution curves vary in shape, and the average energy content fluctuates as well. In our example, energy for poultry is expressed as AMEn (apparent metabolizable energy, nitrogen corrected) in MJ/kg. Sorghum samples from Germany show the highest AMEn content of 13.93 MJ/kg, while samples from Mexico show the lowest of 13.44 MJ/kg. The energy difference of 0.49 MJ/kg corresponds to a monetary value of €13.72/ton and is therefore relevant to be considered.
Within country variation of energy in sorghum is larger than the between country differences. For example, AMEn of German sorghum ranges from 13.3 to 14.2 MJ/kg. This difference of 0.9 MJ/kg corresponds to a monetary value of €25.20/ton, highlighting the importance of quality control even if grains are sourced within a relatively small geographical radius.
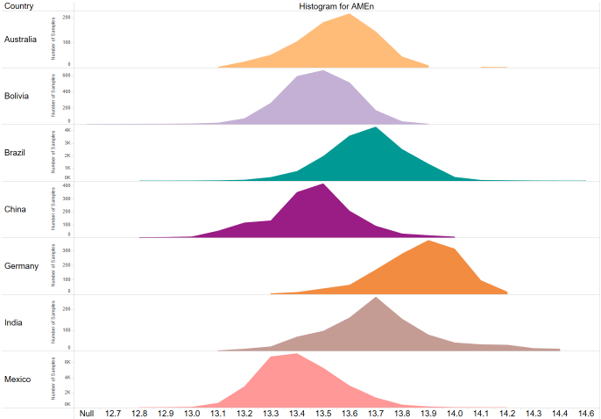
Figure 4: Energy content (AMEn MJ/kg) of Sorghum per country (MJ/kg; AMINONIR®)
For maize, the average AMEn level in the dataset is 13.95 MJ/kg, with a SD of 0.23. Lowest average AMEn values of 13,80 MJ/kg occurred in the USA data and highest of 14.02 MJ/kg in the data from Brazil (Figure 5). In comparison to sorghum it appears that the energy content is more stable in maize. However, AMEn content of Spanish maize ranged from 12.5 to 14.4 MJ/kg, with an average of 13.87 MJ/kg, and a SD of 0.28. The maximum energy difference is 1.9 MJ/kg valued at €53.20/ton highlighting the importance of analyzing the local situation carefully instead of trusting average values.
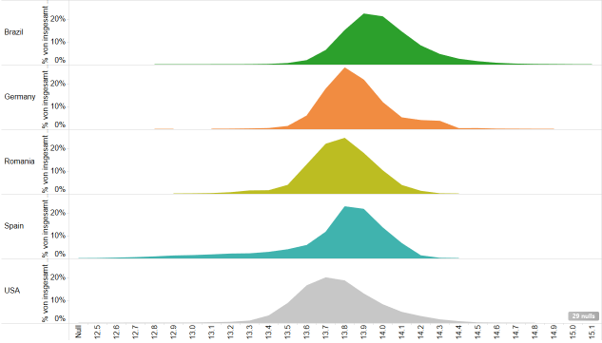
Figure 5: Energy content (AMEn MJ/kg) of Corn per Country (AMINONIR®)
Safety margins: energy in Spanish maize as an example
For precision nutrition, it is essential that the nutrient composition of raw materials is known and that it remains as stable as possible over time. However, as feed mills are dealing with natural raw materials, variation cannot be controlled to 100%. To ensure that the nutrient specifications of the feed are met despite variability in the raw materials, safety margins are used.
In the Spanish maize dataset, the average AMEn level is 13.87 MJ/kg with a SD of 0.28. If the average AMEn value of 13.87 MJ/kg is used in feed formulation, the actual energy content of the feed will be overachieved in 50% of the cases and it will be lower than calculated in the other 50% of the cases. Over supplying energy mainly represents an economic issue, as the feed becomes unnecessarily expensive, and usage of high cost energy sources such as oils could have been reduced. Under supplying energy negatively affects animal performance and feed efficiency and must be avoided.
In order to reduce the risk of under-supplying energy, a safety margin can be implemented, in other words the average energy content of the raw material will be reduced. Usually safety margins are applied based on the SD of the parameter in the raw material of interest. For example, subtracting one SD from the average AMEn of the Spanish maize (13.87 – 0.28 = 13.59 MJ/kg) will ensure that the targeted energy level of the diet is achieved in 84.15% of cases, leaving only a 15.85% chance of undersupplying energy. The usage of a safety margin is reducing the risk of undersupplying energy, but it comes with a cost and reduces the value of the maize by 7.84 €/ton. This examples illustrates the impact of the variation in the data set on the safety margin and the economics: the higher the variation, the higher the safety margin and the costs for compensation in diet formulation or the lower the value of the respective raw material.
Let’s assume that quality control is able to reject maize shipments with a low energy content. What would be the impact if all Spanish maize shipments with an AMEn content of less than 13.59 MJ/kg would be rejected? In this scenario the average AMEn increases slightly from 13.87 to 13.91 MJ/kg and the SD drops by 50% from 0.28 to 0.14. As a consequence the matrix values for feed formulation after applying the safety margins of one SD increase from 13.59 to 13.77 MJ/kg.
The economic value of such improvements are 5.04 €/ton of maize. With an annual feed production of 200,000 tons and a maize inclusion rate of 30%, the annual savings amount to 302,400.00 € (Table 1). Reductions in safety margins for other key nutrients are not yet included in this figure.
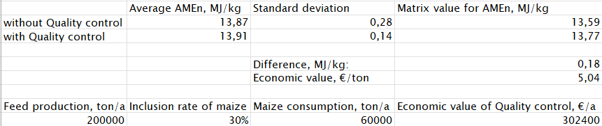
Table 1: Impact of quality control on matrix values and the economic consequences based on the Spanish maize example and it’s energy content.
Protein and amino acids
After energy, crude protein is an important value factor. Sorghum contains about 9.0% crude protein, slightly more than maize that contains 7.8% crude protein. However, in animal nutrition, crude protein is less important than amino acids. Proteins consist of amino acids, some of which must be supplied through feed because animals cannot synthesize them. These amino acids are called essential amino acids, and the following focuses on the most important essential amino acids.
Compared to maize protein, sorghum protein is lower in lysine, methionine, and cystine, but higher in tryptophan, leucine, and valine (Table 2). Lysine receives special attention in animal nutrition because it is used as the reference essential amino acid — it is usually the first-limiting amino acid in pigs and the second-limiting amino acid in poultry after the sulfur-containing amino acids methionine and cystine.
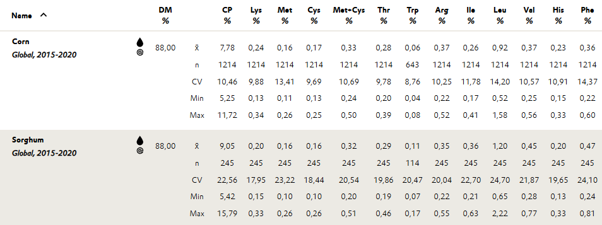
Table 2: Amino acids contents (%) of Sorghum and Corn (AMINODat®)
On average, sorghum contains 0.20% lysine and maize 0.24% (AMINODat®). By country, lysine in sorghum ranges from 0.19 to 0.23% which translates in value difference of 0.77€/ton. In maize, averages per country vary only slightly, but within country variation is large: lysine in Brazilian maize ranges from 0.15 to 0.45% which translates in an economic difference of 5.78 €/ton.
It is important to consider, that amino acid contents vary greatly even at a constant crude protein level. In sorghum with 8.5% CP, lysine may range from 0.16 to 0.26% (Figure 6) and in maize with 7.8% CP, lysine may range from 0.16 to 0.30%. These variations correspond to an economic value of 1.92 €/ton for sorghum and 2.69 €/ton for maize — demonstrating the importance of analyzing amino acids rather than estimating them based on crude protein values.
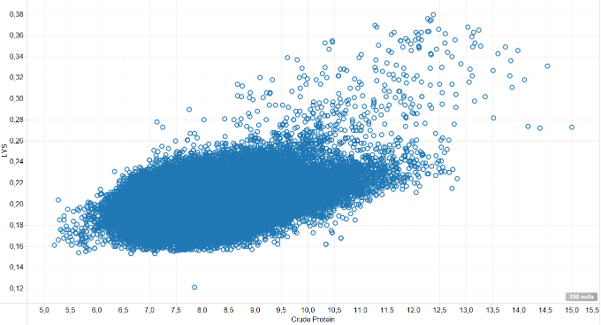
Figure 6: Sorghum: Lysine content (%) over Crude Protein content (AMINONIR®)
Full fat soybeans
Protein sources like oilseed meals are central to supplying amino acids. Globally, soybean meal is the dominating protein source. In Europe, the cultivation of legumes has increased in recent years to reduce dependency on imports. As a result, locally produced full fat soybeans and soybean cakes/expellers are increasingly available.
In a dataset from 2021–2025 with 93,968 samples from Ukraine, Hungary, Germany, Brazil, and South Africa, the average crude protein in full fat soybeans is 35.97% (SD 1.89; CV 5.2%), but it ranges from 24.6 to 46.5%.
Focusing on lysine, it can be seen that its content varies even at a constant crude protein level. At an average crude protein level of 35.97%, lysine content of full-fat soybeans ranges from about 2.05 to 2.45% (Figure 7). If this difference must be corrected through lysine supplementation, costs amount to 7.68 €/ton of full-fat soybeans.
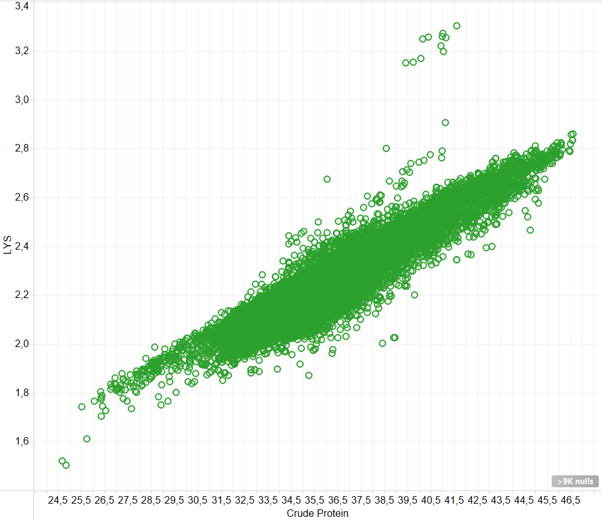
Figure 7: Soybean full-fat: Lysine content (%) over Crude Protein content (%; AMINONIR®)
The average lysine level in the dataset of full-fat soybeans is 2.22% with a SD of 0.12 (CV 5.4%). The minimum and maximum lysine values are 1.50 and 3.30%. By country, Brazil shows the lowest average lysine content of 2.19% and Germany the highest of 2.44% — a difference worth 4.80 €/ton of full-fat soybeans. Full-fat soybeans from Germany showed the highest lysine content but at the same time they had the highest variation with a SD of 0.15. In comparison, lowest variation occurred in full-fat soybeans from Ukraine and South Africa with a SD of 0.09.
Distribution curves highlight the differences between the countries more clearly (Figure 8). German full fat soybeans show a left skewed distribution with many low lysine samples. Hungarian data show a similar but weaker pattern. South African samples include a subpopulation with high lysine contents of about 2.40% whereas other countries have only very few samples with a lysine content higher than 2.40%.
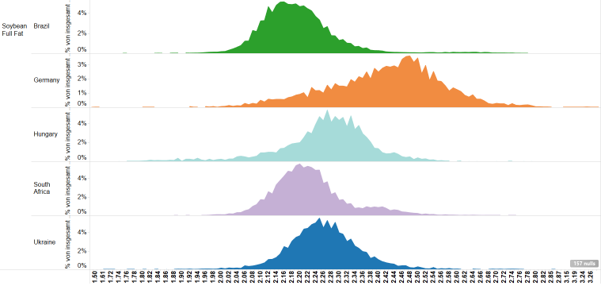
Figure 8: Lysine content (%) of soybean full-fat per country (AMINONIR®)
These examples highlight the importance of analyzing local raw materials rather than relying on table values. Higher SD in the German dataset has significant consequences when safety margins are applied. With a one SD safety margin, lysine is reduced by 0.15 %-points in German soybeans but only by 0.09 %-points in South African and Ukrainian soybeans — reducing their value by €2.88/ton and €1.78/ton respectively.
Let’s take the German full-fat soybeans and assume that purchasing and quality control allow only soybeans with a lysine content of at least 2.29% to be stored (average of 2.44% minus SD 0.15). Rejecting low lysine batches increases the average lysine content from 2.44 to 2.47% and reduces SD from 0.15 to 0.11. In consequence, the lysine value used in diet formulation (mean minus SD) increases from 2.29% to 2.36% — worth €1.34/ton.
Benefits of protein reduced feeding
Animals require amino acids in exactly the right amounts and ratios. A 5% deficiency already worsens feed conversion and increases feed costs by about 13%. Excess protein promotes harmful bacteria in the gut, leading to microbiome imbalance and compromising gut health. Excess protein also burdens the metabolism due to the need to detoxify excess nitrogen, increasing water consumption and nitrogen emissions.
Using supplemental amino acids is a proven strategy to reduce crude protein in compound feed while maintaining animal performance, reducing nitrogen emissions, and promoting animal welfare. Lower nitrogen levels in manure reduce ammonia emissions, leading to drier litter and improved air quality — with practical benefits such as fewer respiratory problems and reduced footpad dermatitis in broilers.
Studies consistently show that each one percentage point reduction in crude protein content results in approximately 10% lower nitrogen excretion. To achieve this, a precise knowledge of the nutrient composition of feed ingredients and the animals’ amino acid requirements is essential.
Support through the use of Evonik’s AMINOServices
For precise, need based feed formulation, it is necessary to understand animals’ nutrient requirements as accurately as possible. However, nutrient requirements are not static — they vary by species, breed, age, sex, housing conditions, and production goals. Here, AMINOSpec® can provide support. AMINOSpec® is a digital solution for calculating nutrient recommendations for broilers, laying hens, finishing pigs, and aquatic species while taking different production conditions and goals into account. For example, broiler feed can be optimized either for live weight or breast meat yield depending on market requirements.
For raw material and feed analytics, the AMINONIR® service provides valuable support. AMINONIR® calibrations cover more than 60 commonly used raw materials and compound feeds and therefore fully meet the needs of feed producers. The calibrations are continuously updated with current samples from around the world. This ensures that relevant changes in quality and composition are reflected in AMINONIR®, keeping the system up to date.
In addition to AMINONIR®, Evonik offers AMINODat® — the most comprehensive database for animal nutrition worldwide, with data on more than 1,6 Mio raw material samples and over 97 Mio analytical results. AMINODat® is updated once a year and provides a clear overview of raw materials by country and quality category based on a robust data foundation. It serves as a reliable source of information and is used as a reference work.
Conclusion
To maximize animal health and performance and align feeds as precisely as possible with the animals’ needs, it is essential to continuously monitor the quality of the raw materials used.
Through comprehensive and nearly real time insights into the nutrient value of feed ingredients using AMINONIR® analysis, feed manufacturers and livestock producers can rely on accurate, up to date, science based data to make better decisions and achieve better results.
These technological solutions and services offered by Evonik enable the production of cost effective and efficient feeds that meet the animals’ nutritional requirements — thereby improving productivity, sustainability and profitability.
The content of this document is for the information and assistance of Evonik’s customers and is not applicable to products marketed or sold in the United States. Evonik markets its products in compliance with applicable local laws, but it is the user’s responsibility to ensure that the use of and any claims made for this product comply with all relevant requirements. This document may not be published in the United States without the express written consent of Evonik Operations.